 Deutsch
 English
Enable the peer-to-peer player
Do you want to enable the peer-to-peer player?
PeerTube's peer-to-peer player improves performance by sharing cached video data with other people who are watching this video right now.
This technically requires personal data (specifically your IP address) to be sent to those people. DevTeams.AT cannot know in advance who these people are and what they will do with the data.
Do you really want to enable the peer-to-peer player and share your IP address with unknown people?
Listen to this post as a podcast — enable the player to load the audio episode.
Here’s a graph that I have shown many times—in trainings, during conference talks and elsewhere. It shows how the marginal cost of software features changes over time - kind of, as we’ll see later. And a talk by Kent Beck inspired me to think about it again.
Marginal Cost of a Feature
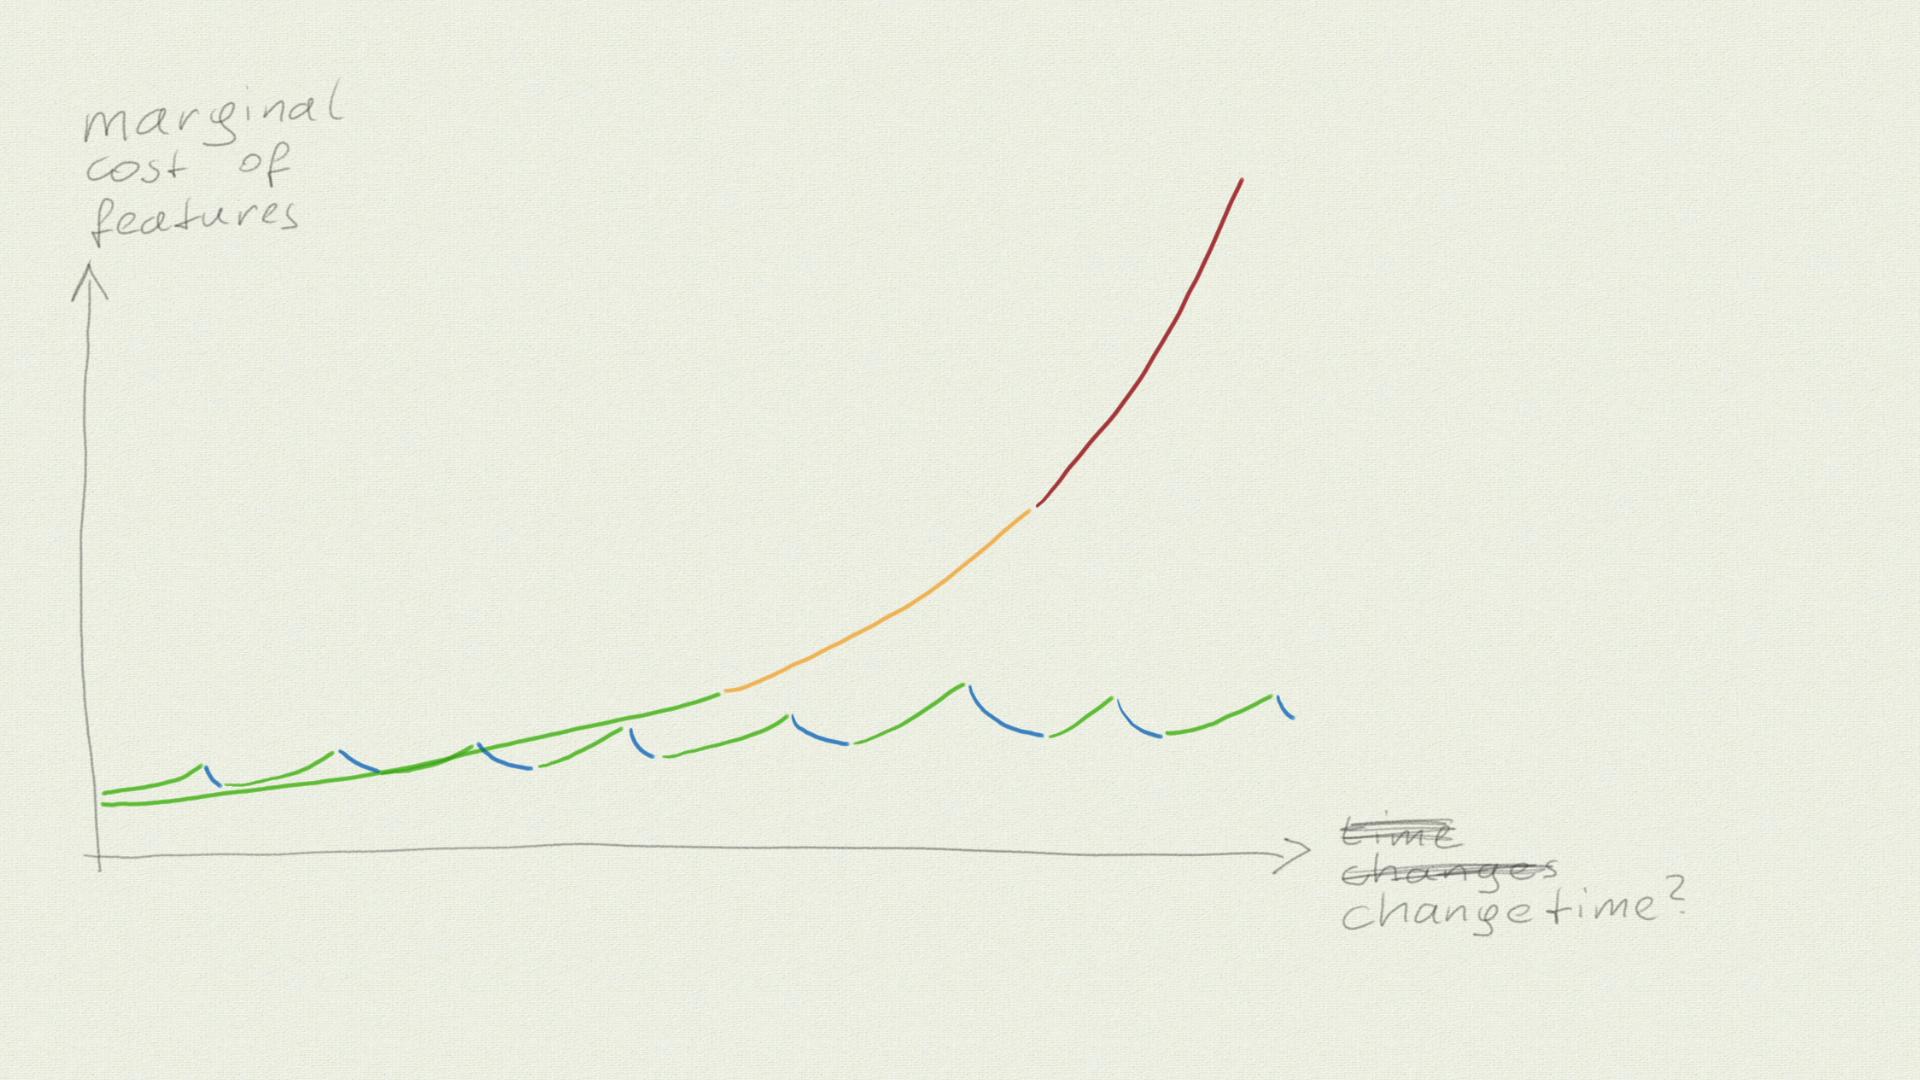
The graph below shows the marginal cost of software features and how it changes over time.
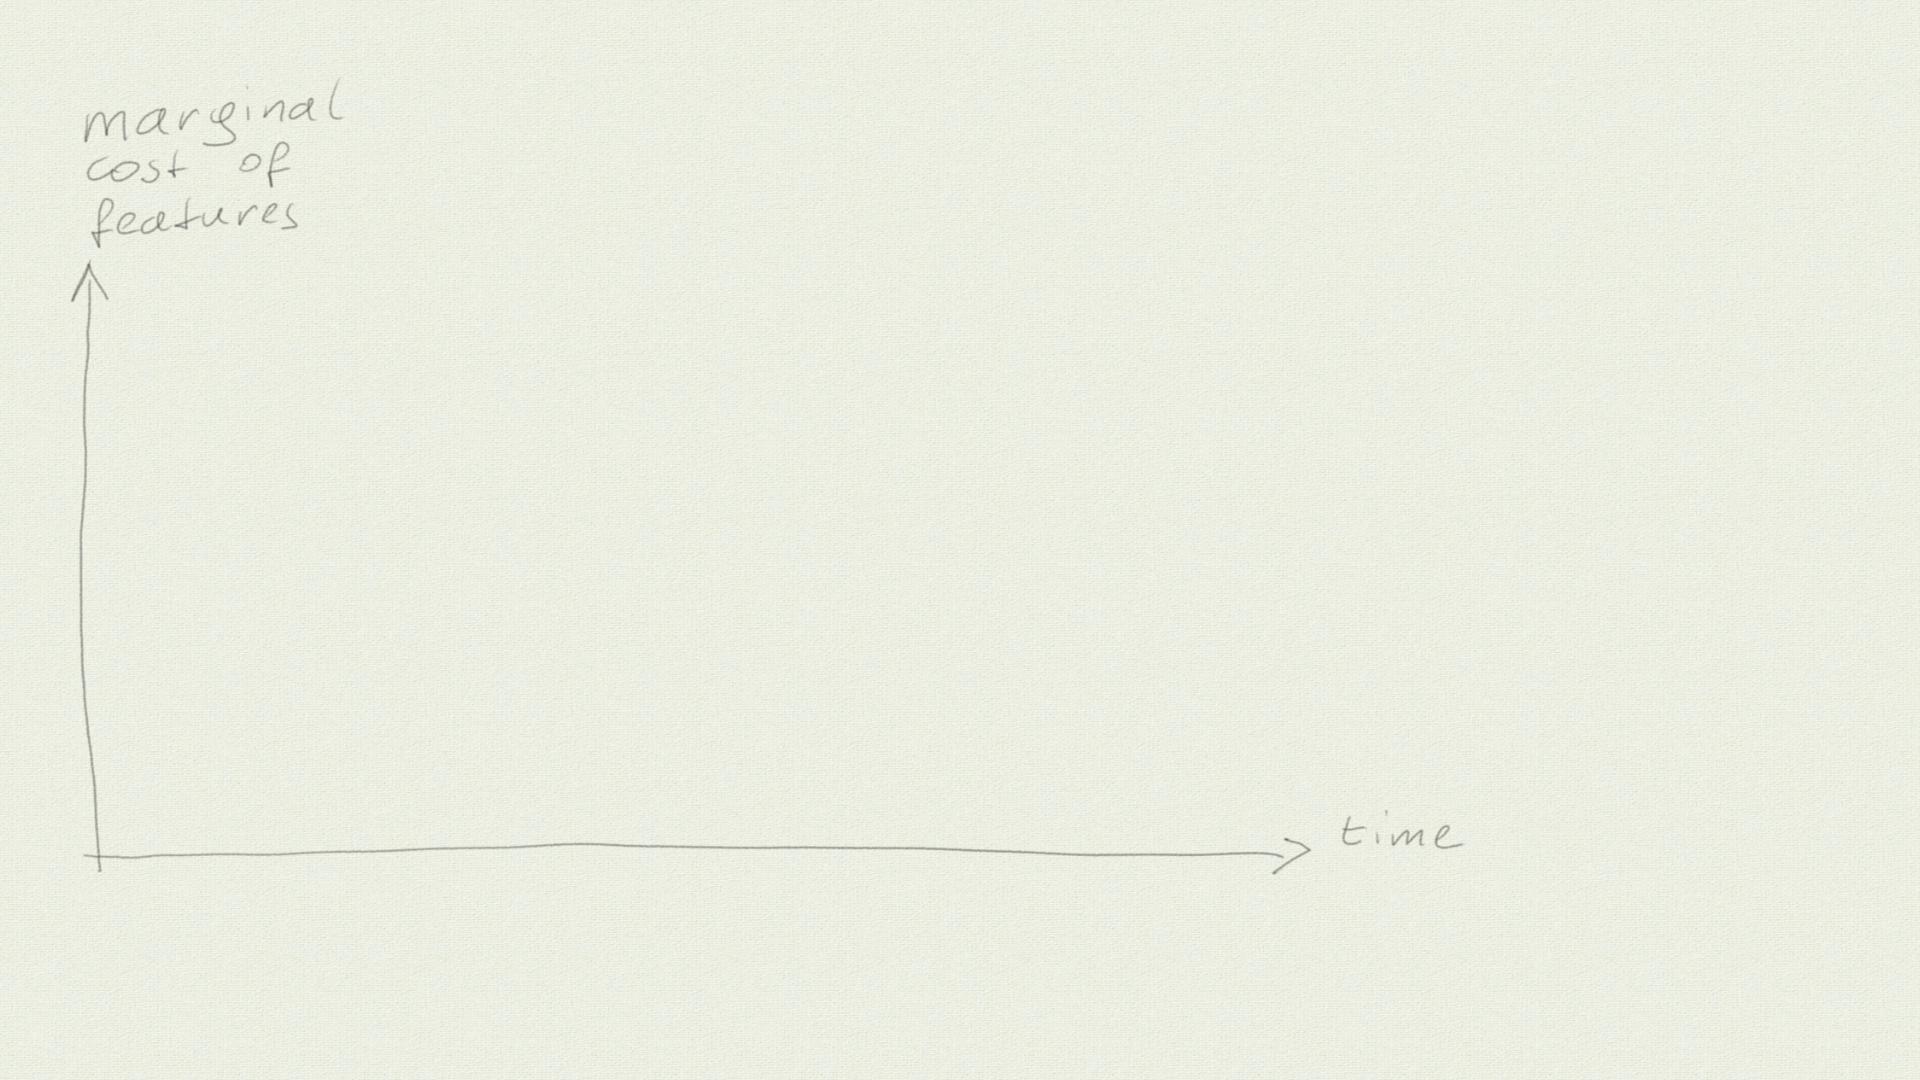
When we start a new project, on the mythical green field, adding new features is cheap. But as the months or years go by, the more expensive it gets. And at some point, we seem to hit a wall: The cost for adding new features rises so quickly that we barely get any software out to our users at all.
But the “time” axis cannot really be about time. When we just leave the software alone, or when it is really “done”, adding new features does not get more expensive anymore. It looks like adding features is getting more expensive over time, but actually it’s getting more expensive the more changes we make. (*)
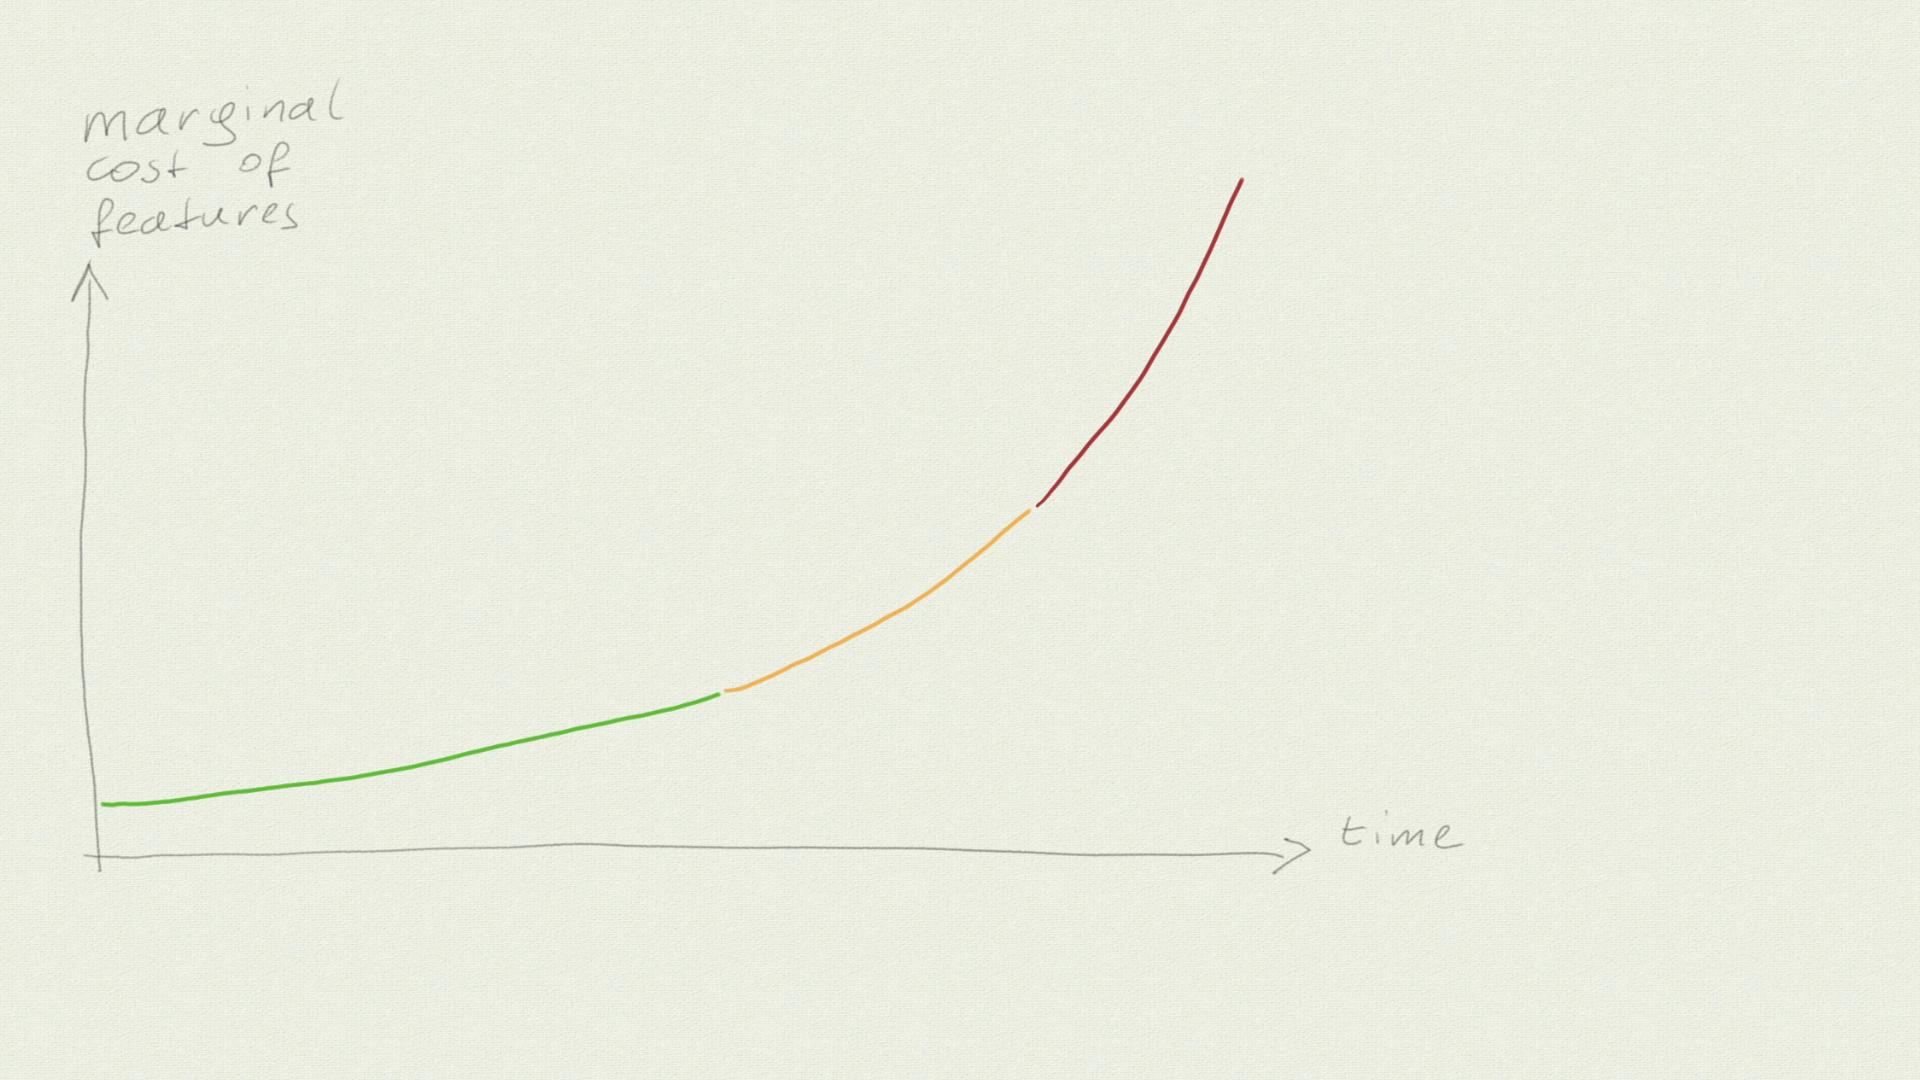
What I have shown here is the trajectory of the typical “waterfall” or “water-scrum-fall” (i.e. “agile theater”) project, where we are always under pressure to deliver and we spend most of our time adding features and somehow paint over the problems that arise.
But we could also make some changes to bring the cost down again…
I can draw a second curve that shows this scenario: Every time the costs rise, we make some changes to bring them down again, and not to add new features.
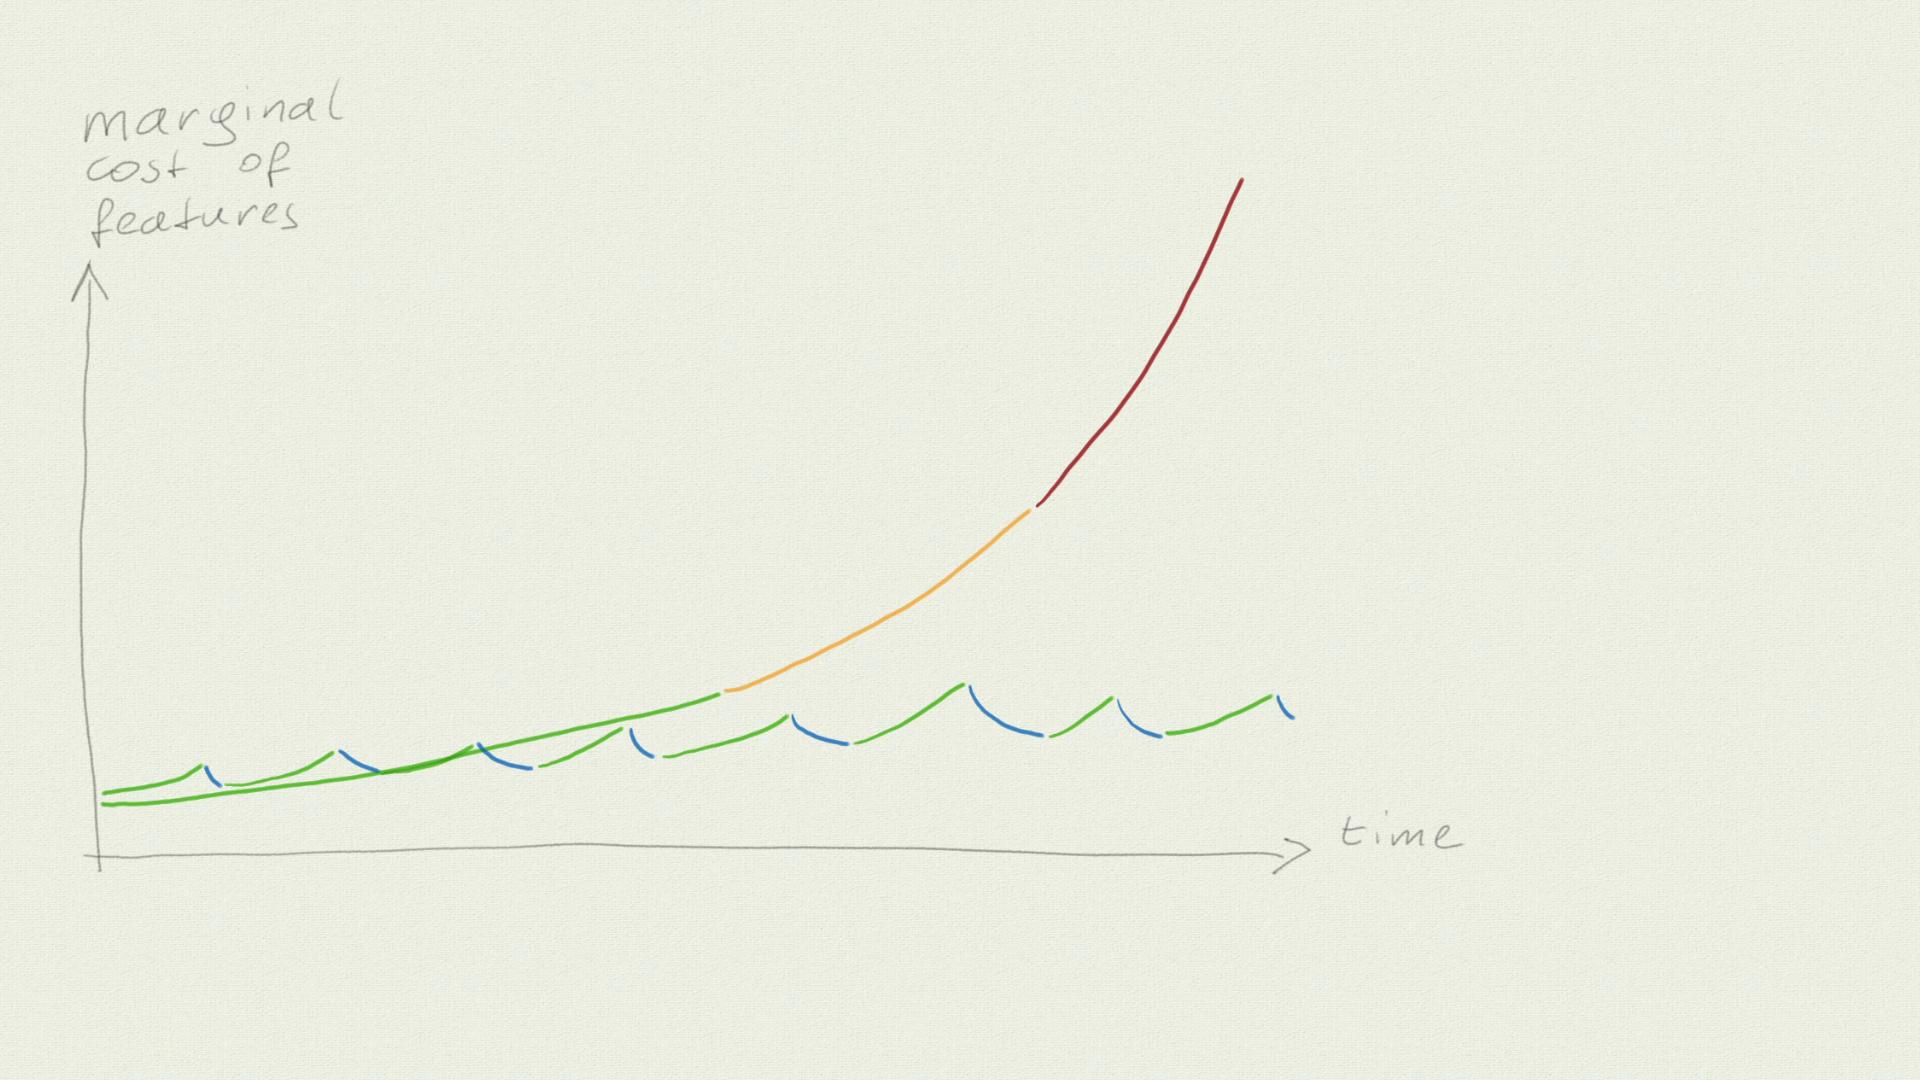
At first, this is more expensive because we are not delivering valuable features while we work on bringing down the cost. But in the long run, it prevents us from hitting the wall. Or at least the wall is much further away here.
Futures vs. Features
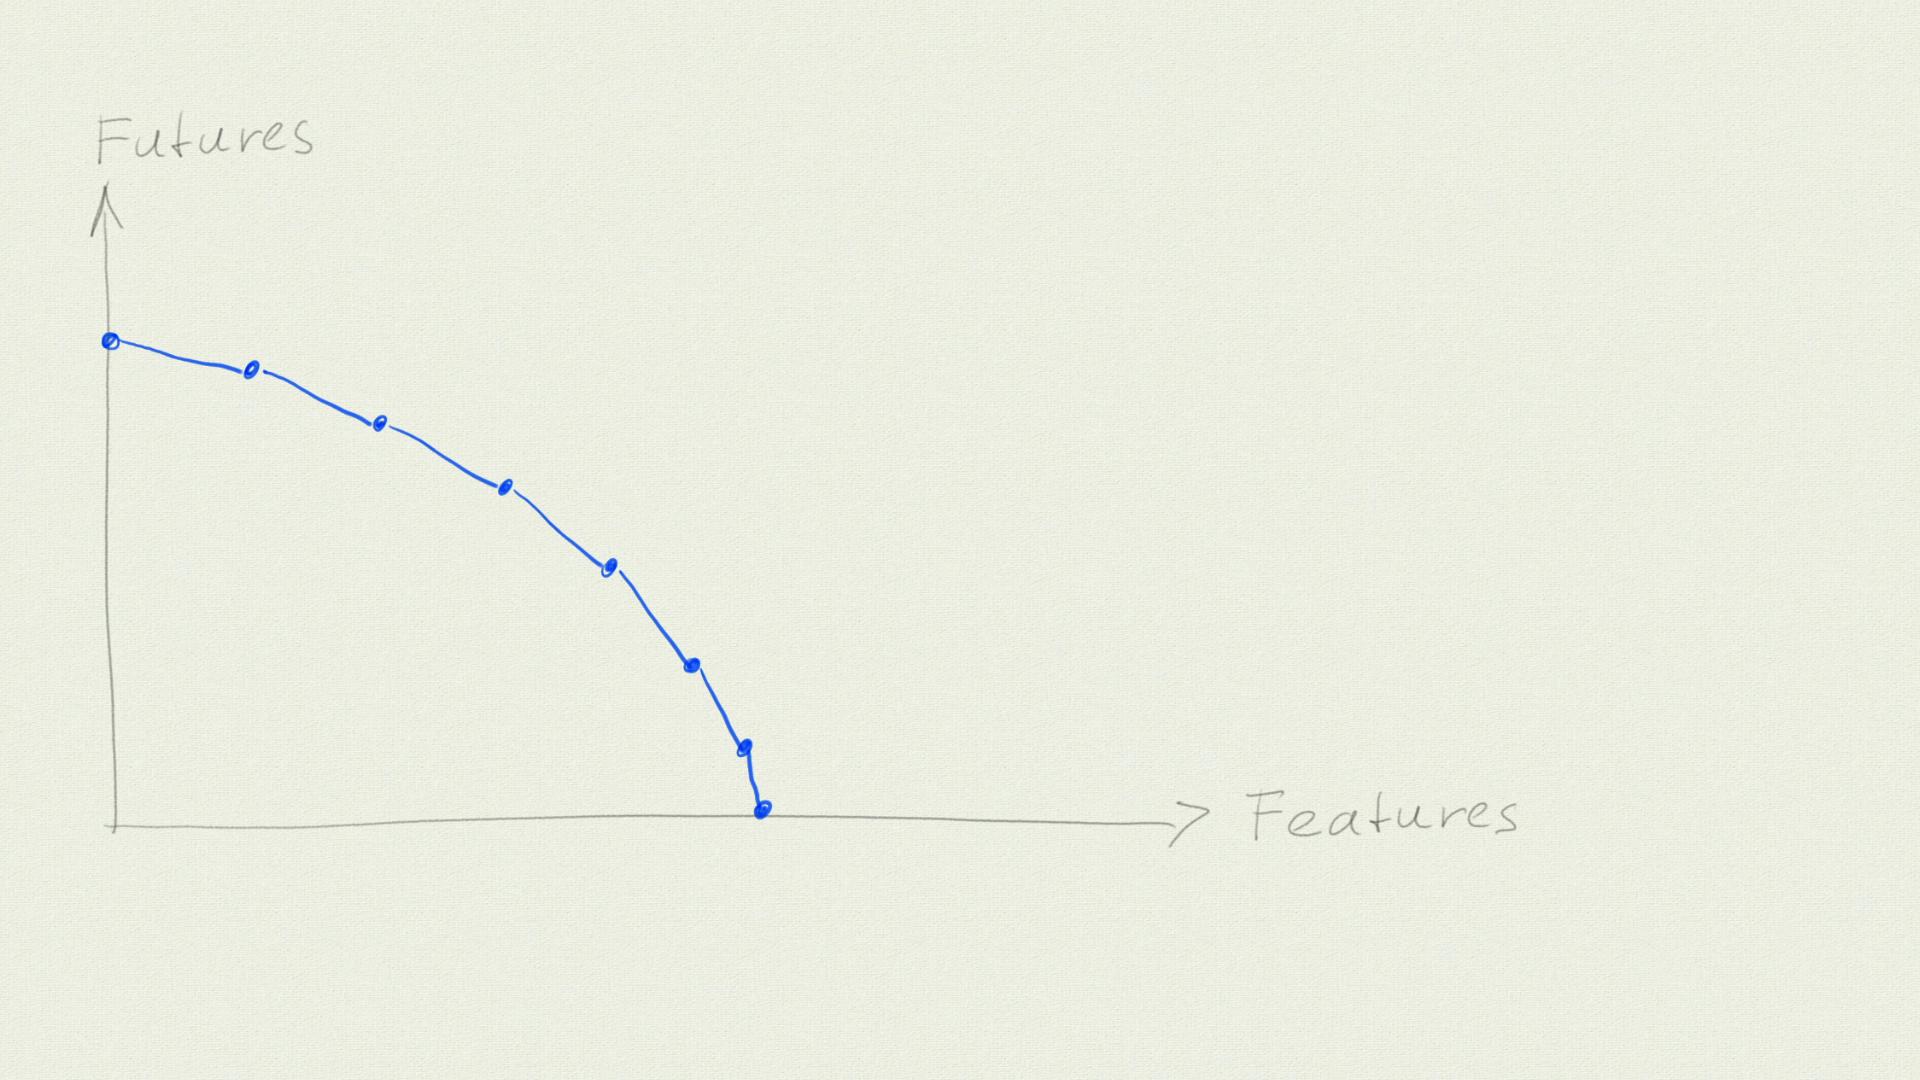
Now, here’s another chart: My recreation of a graph that Kent Beck drew during his conference talk Software Engineering After AI. It is related to what I described before, but not the same.
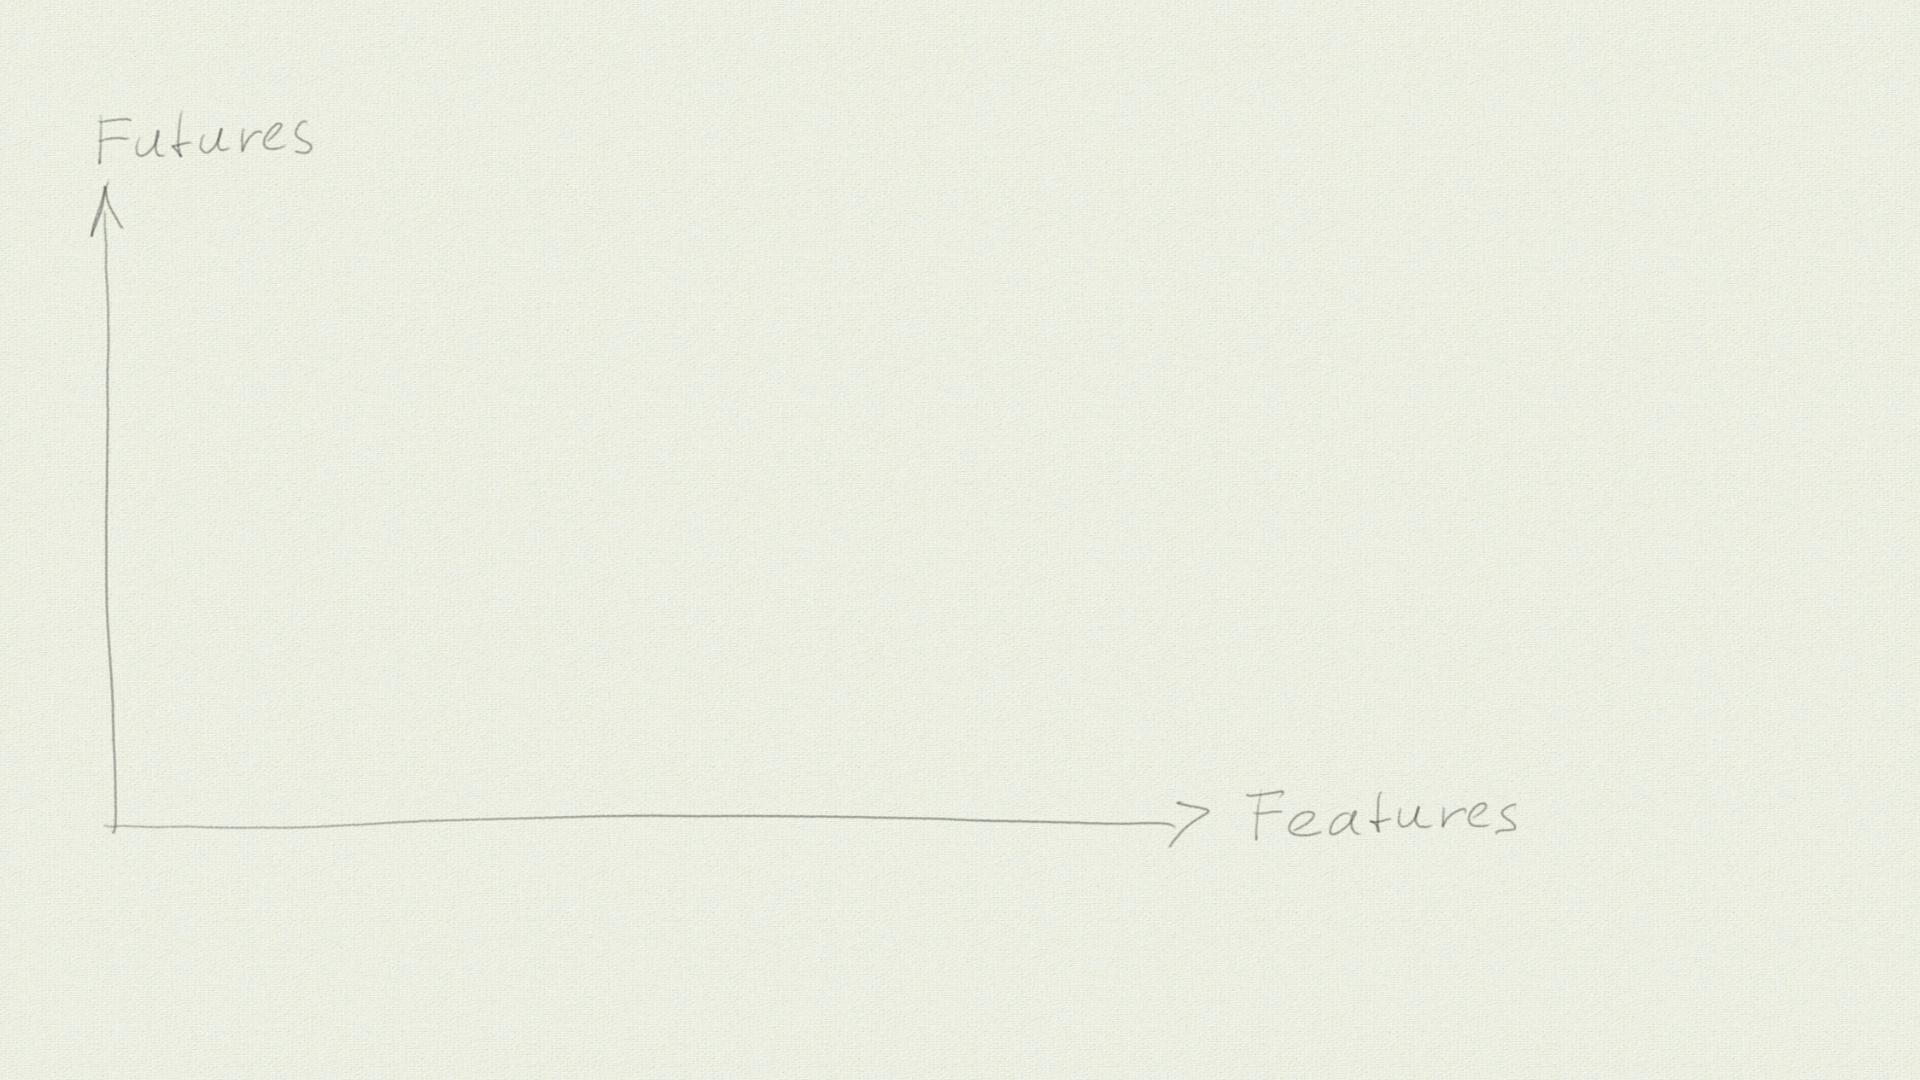
On the y-axis, we have “Futures” (aka options): The different things we can still do in the future or the options we have left. The x-axis shows the features our product has.
We start with 0 features, but at that point, we have a lot of options. As we add features, we end up with fewer and fewer futures. And at some point, we have used up all our options and cannot add any new features anymore. We have hit the metaphorical wall from before.
But, just as before, we can work on adding new futures every now and then. If we get this right, we might postpone the point where we hit the x-axis, maybe even indefinitely. Or, even better, we might manage to achieve a trajectory where the number of our futures rises over time.
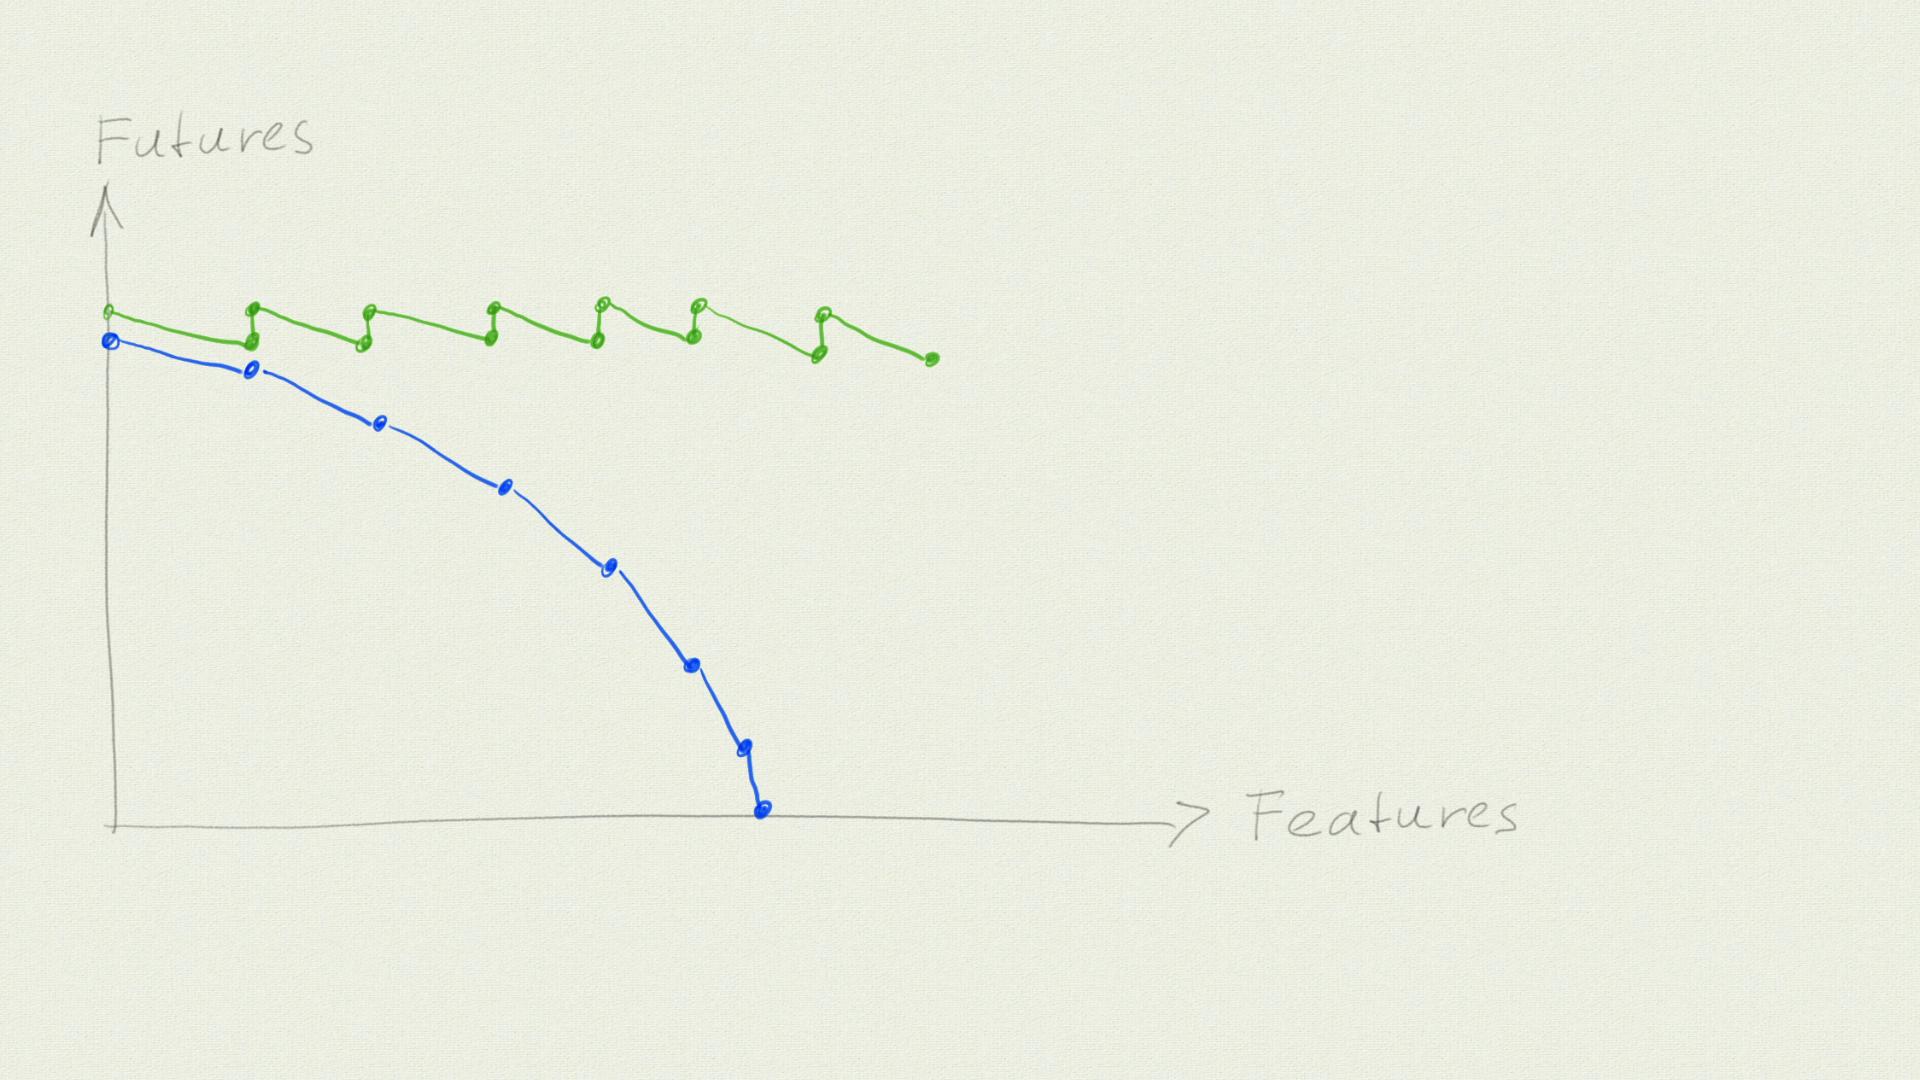
Speaking of time: Note that this graph does not contain it. Time is implicit: As we follow the lines, every new point on that line is a later point in time. But we can move freely along the axes: We can also remove features, and increase or decrease our futures by doing so.
What Each Graph Tells You
The first graph—the one I have been using in the past—gives us a hint about time and effort. We need to make changes to bring the cost down, and thus time passes. Also, cost is maybe more tangible for many people working in software development than “futures”.
But I also had a “heureka”-moment when I watched Kent Beck’s talk on YouTube: The options we have left are a part of the value of our product, and so are the features. Still having the possibility to decide has a value on its own. And increasing our options brings the cost of future development down. So, in Kent Beck’s visualization, both axes tell us something about the value of the software! (If you want to read in-depth about options and value, try to get a copy of the book Commitment)
The two are linked: Improving our futures/adding options brings the cost of new features down. Or, in other words, the cost of features is a proxy measure for how many options we have left.
What both graphs don’t tell you is how much you “lose” in the short term by working on adding options and bringing the marginal cost of features down. While you are working on that, you don’t deliver any features. If we assume that features created are a proxy for value created (**), then you create less visible value in the short term but more in the long term.
I’ve been thinking about different ways to show that for some time. If I ever come up with a good one, I will write a follow-up post here.
And the graphs also don’t tell you why it’s definitely a good idea to split those two phases. If you want to know more about that, Kent Beck’s book Tidy First? will get you started.
How Can You Use It?
I have worked with clients where it was normal that some things would take forever, and nobody questioned it. The problem here is: Once you are at this point, nothing is cheap or easy anymore. Going forward, doing business-as-usual is expensive, but trying to climb down from that mountain is expensive and hard.
If you are not there yet, look at these graphs. Try to assess honestly where you are. Think about what you can do to bring the marginal cost down a little bit. And then, prioritize it and start working.
Oh, and if your response is “We use AI, this does not matter to us anymore”: I am very sure that working on increasing options and keeping feature costs low still matters, or maybe even matters more than ever. But that is also a topic for a future essay.
(*) I explained that the x-axis cannot be “time”, but it also cannot simply be “changes”: As the software becomes more complicated, the frequency of changes goes down. So it’s “time” again, but only as long as we make changes? Or something like “changetime”? If I ever come up with a good explanation, I will write it up here.
(**) That’s not true for every feature—Some do not bring any value, some others might even decrease the value of the product. But on average, your features should be valuable.